Preliminary data
Population and housing numbers
User’s Guide
You can scroll between the pages of the publication using the arrows on the edges of the screen:
| forward to the next page | |
| back to the previous page |
You can also use the following keys to navigate:
| PgDn | forward to the next page |
|---|---|
| PgUp | back to the previous page |
| Home | jump to the first page |
| End | jump to the last page |
| F | switch to full screen mode |
Foreword
The Hungarian Central Statistical Office conducted the 16th census of Hungary between 1 October and 28 November 2022. The census carried out without paper questionnaires accelerated the processing of the data, just two and a half months after the end of the census, we can already publish the first results showing the evolution of the population and the number of housing stock.
The data presented here reflect the situation at the reference date of the census, 1 October 2022. They give us the opportunity to evaluate the population processes behind the evolution of the population size, as well as the picture of the housing stock of the country and the counties that is formed as a result of the housing construction activity of different periods.
The processing of the data is continuous, and those interested can study the increasingly rich information on the census sub-page of the HCSO website, and it will also be available in the census information database.
Contents
- Foreword
- Population size and components of population change
- Population by age groups
- Territorial data of population
- Housing stock
- Summary data, information
Changes in the number of population
On 1 October 2022, the population of Hungary was 9 million 604 thousand. At the time of the first census, in 1870, there were just over 5 million people living in the current territory of the country. By 1980, the population had reached 10 million 709 thousand, but has been falling steadily since then. The main reason for this is that deaths are increasingly outnumbering births. Over the last 11 years, this decline of 464 thousand has been significantly reduced by a 131 thousand immigration surplus, mainly from surrounding countries.
Changes in live births and total fertility rate
Between the last two censuses, both births and deaths have fluctuated. The year 2011 marked the low point in birth statistics, but recent years have been characterized by increasing fertility, with the total fertility rate rising from a historic low of 1.23 in 2011 to above 1.5.
Changes in the number of deaths
The number of deaths has been around 130 thousand per year, rising in the years affected by the Covid-19 epidemic to 141 thousand in 2020 and 156 thousand in 2021.
Contents
Population composition by main age groups
On 1 October 2022, 21% of the population was elderly, while the proportion of children was 15%. Between 2011 and 2022, the population aged 65 and over increased by 318,000 and its share in the total population by 19%. At the same time, the group of children aged 0–14 years decreased slightly and the active population aged 15–64 years decreased significantly.
Population composition by age groups and sex as % of total population
In the period between the last two censuses, the age structure of the population of our country has continued to grow older.
Contents
- Foreword
- Population size and components of population change
- Population by age groups
- Territorial data of population
- Housing stock
- Summary data, information
Population change by county
According to census data, Budapest has a population of 1 million 682 thousand, followed by Pest county (1 million 339 thousand), which is the most populous region in the country. The least populous county is Nógrád, with 183 thousand inhabitants.
While the population has increased in two counties (Pest and Győr-Moson-Sopron) since the last census, it has decreased in the other counties and the capital. The largest increase (10%) was in Pest, while the largest decrease (13%) was in Békés county.
Population density by county
Budapest is the most densely populated region in the country, with Pest, Komárom-Esztergom and Győr-Moson-Sopron standing out among the counties. The least densely populated Somogy county has barely a quarter as many inhabitants per km² as Pest county. The territorial concentration of the population is clearly demonstrated by the fact that in 2022 18% of the country’s population lived in Budapest.
Population composition by types of settlement since the 2011 Census
Population relations show different patterns in different types of settlements, in terms of fertility, mortality and migration. Although population decline is observed in all types of settlements, it is lowest in villages (1.8%), quarter as high as in cities with county rights (6.8%).
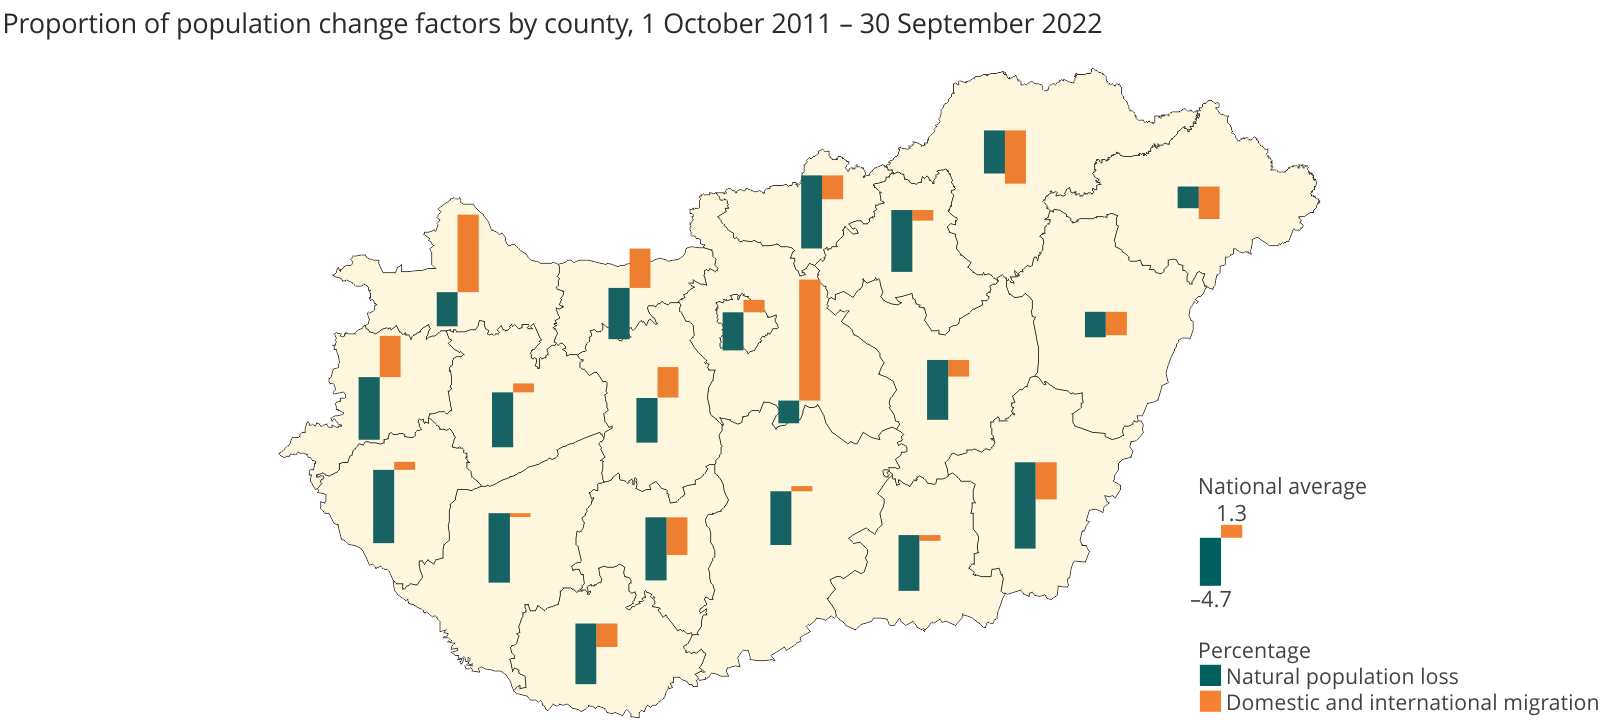
Proportion of population change factors by county
Population change has affected each county differently. The natural decrease was lowest in Szabolcs-Szatmár-Bereg and Pest counties and highest in Békés county. Pest county was the biggest winner in terms of migration, while Borsod-Abaúj-Zemplén county had the weakest population retention.
Population change factors by type of settlement
There were significant differences in the migration gap by type of settlement. Out-migration surpluses were only recorded in the case of cities with county rights between the last two censuses, while the other types of settlements recorded migration surpluses.
Age composition by county
Pest, Borsod-Abaúj-Zemplén and Szabolcs-Szatmár-Bereg counties have the highest proportion of the population aged under 18 (17%). Zala county has the highest proportion of elderly (25%), but Békés and Somogy counties also have a share of population aged 65 and over of around 24%.
Age composition by type of settlement
As the size of settlement increases, the share of population under 15 decreases: the share of children is highest in villages (16%), and lowest in Budapest (almost 13%). The proportion of elderly people is highest in the cities with county rights.
Contents
Changes in the number of dwellings
Hungary’s housing stock increases from census to census. In 2022, there were 4.6 million dwellings in the country, an increase of 4.6% in 11 years. Between 2011 and 2022, 171,000 dwellings were built. Within this, 2013 was the low point, before the pace of housing construction accelerated in the second half of the decade.
Change in housing stock by county since the 2011 Census
The number of dwellings increased in all counties of the country except Békés, with the largest increases in Győr-Moson-Sopron, Pest and Somogy counties. The growth in the number of dwellings was typically higher in the Transdanubian counties than in the eastern part of the country.
Distribution of housing stock by type of settlement
The number of dwellings has increased most in rural towns over the past 11 years, while it has barely changed in villages.
Additional data and information
Preliminary data in Excel format
Contact details:
kommunikacio@ksh.hu
Contact us!
Telephone: (+36–1) 345–6789
www.ksh.hu